VulnTrackPro — Threat-Aware Vulnerability Management
The Problem With Traditional Vulnerability Management
Every security team runs vulnerability scanners. Nessus alone sits inside thousands of enterprise networks, dutifully producing scan reports week after week. But here’s the disconnect: having scan data is not the same as managing vulnerabilities.
Most teams face the same set of problems. Scanners produce thousands of findings sorted by CVSS — a technical severity score that says nothing about whether a vulnerability is actually being exploited in the wild, whether a Metasploit module exists for it, or whether an APT group targeting your region has weaponized it. A CVSS 9.8 that has never been seen in the wild gets patched before a CVSS 7.5 that has a public exploit, KEV listing, and active ransomware campaigns built around it.
Beyond prioritization, there’s the operational chaos: scan results live in CSV exports and spreadsheets, remediation timelines aren’t tracked, SLA breaches go unnoticed, and leadership asks “what’s our risk posture?” — and no one has a clean answer.
VulnTrackPro was built to close all of these gaps.
What VulnTrackPro Is
VulnTrackPro is a full-lifecycle vulnerability management platform that takes raw Nessus scan output and turns it into an actionable, threat-informed risk management program. It handles the entire pipeline: scan import, asset mapping, risk scoring, remediation tracking, SLA enforcement, threat intelligence enrichment, MITRE ATT&CK mapping, executive reporting, and an AI-powered chat assistant — all in a single, self-hosted application.
Scan Import & Scanner Connectors
Vulnerability data enters VulnTrackPro through a flexible import layer designed to work with any scanner — not just Nessus. The Import Scan page supports two modes:
- File Upload — Drag and drop
.csv,.nessus(XML), or.xmlscan exports up to 1 GB. The platform auto-detects the format, parses every finding, and maps vulnerabilities to existing assets by hostname or IP address. If an asset doesn’t exist yet, it’s flagged for review. - Nessus Server Connector — Direct API integration with a Nessus scanner instance. Configure the server URL, API keys, and scan schedule — VulnTrackPro pulls completed scans automatically without manual file exports.
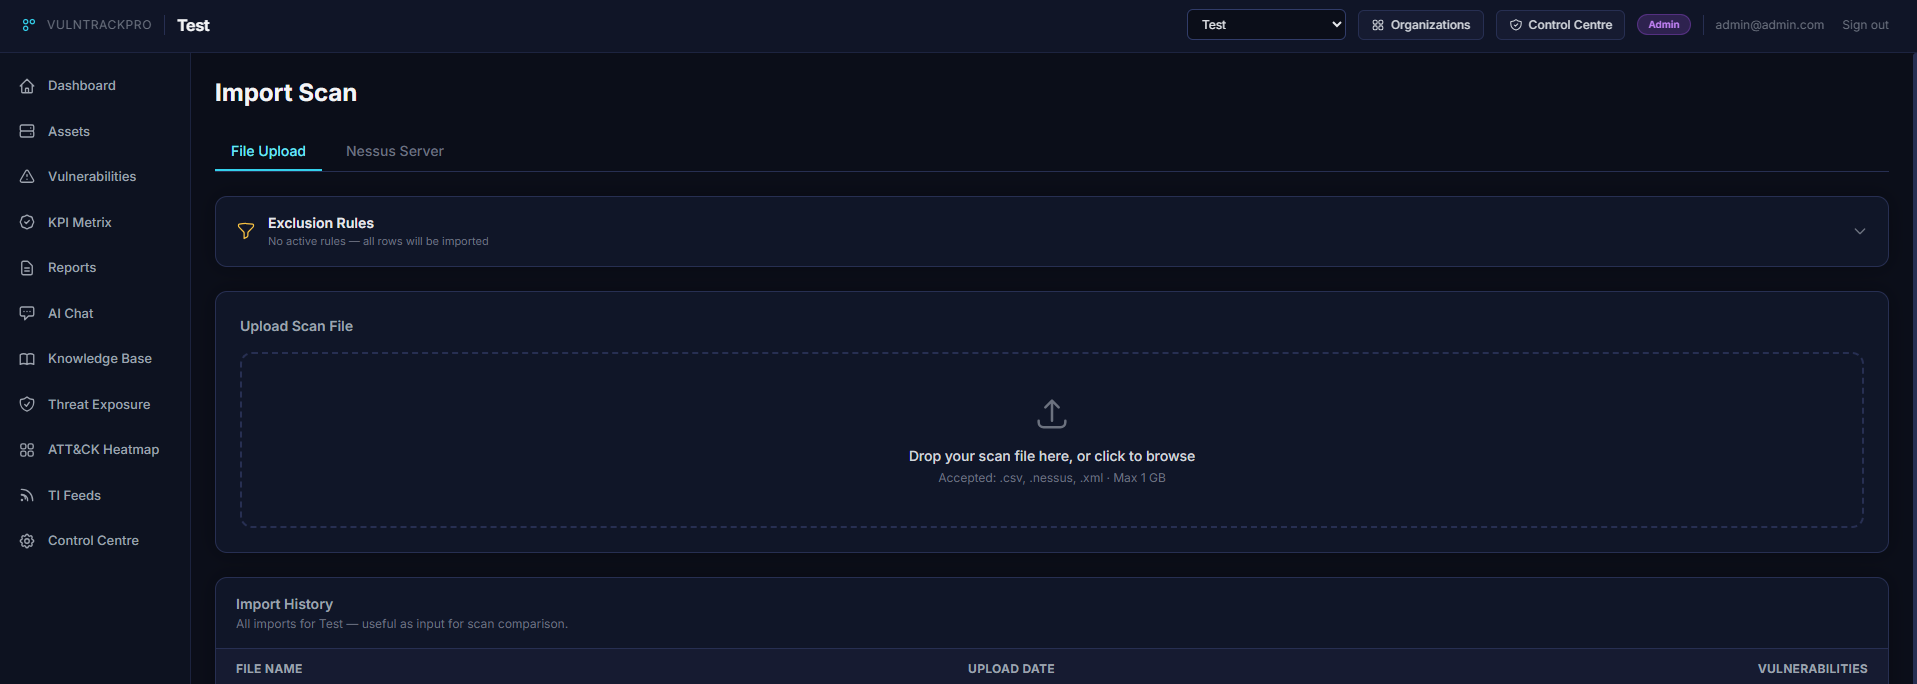 The Import Scan page — file upload with drag-and-drop support (.csv, .nessus, .xml), exclusion rules engine, and full import history for scan comparison.
Exclusion Rules Engine
Not every scan finding belongs in your vulnerability database. The Exclusion Rules engine lets admins define per-organization filters that suppress noise at import time — before findings ever hit the database. Rules support four operators: exact match, contains, less-than, and greater-than — applicable to any field including plugin name, severity, CVSS score, or CVE ID. This is how you filter out informational findings, scanner artifacts, or known false positives without manual cleanup after every import.
Import History & Scan Comparison
Every import is logged with filename, upload date, and vulnerability count. This history feeds directly into the Scan Comparison feature — select any two scans and VulnTrackPro diffs them to show what’s new (appeared since the last scan), what’s fixed (present before, absent now), and what’s persistent (still open). This is the core remediation tracking loop: import, compare, identify what changed, act on it.
Beyond Nessus — Extensible by Design
While the current connectors target Nessus (the most widely deployed enterprise scanner), the import architecture is format-agnostic. The parsing layer separates scan file parsing from vulnerability ingestion — adding support for Qualys, Rapid7 InsightVM, OpenVAS, or any scanner that exports CSV/XML is a matter of writing a new parser module, not redesigning the pipeline. The roadmap includes connectors for these platforms.
Dashboard & Risk Visibility
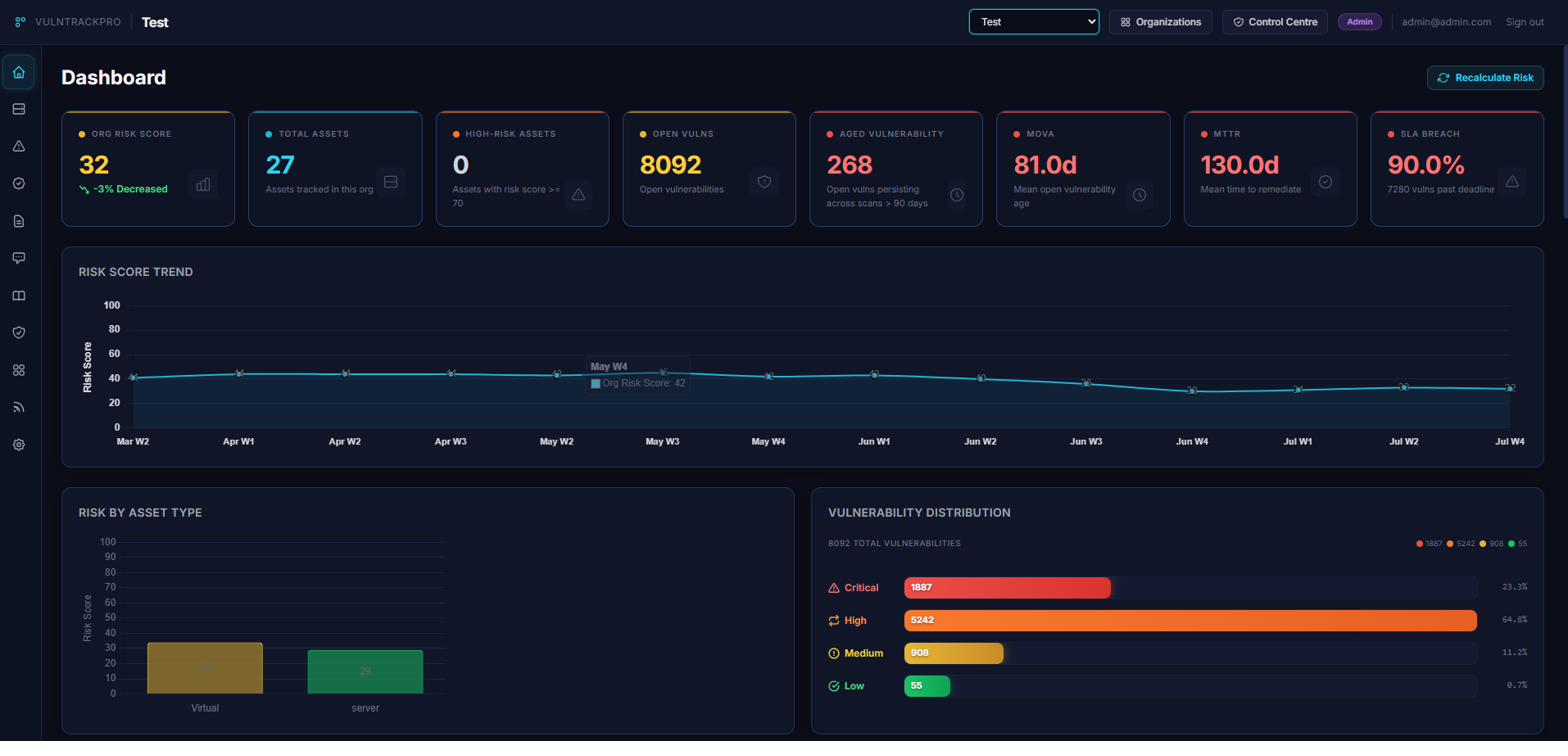 The main dashboard — Org risk score of 32 (down 3%), 27 tracked assets, 8,092 open vulnerabilities, and risk trend over 20 weeks.
The dashboard is designed to answer the question every CISO asks: “Where do we stand?”
At the top, six KPI cards give the instant snapshot: Org Risk Score (0–100), Total Assets tracked, High-Risk Assets (risk score ≥ 70), Open Vulnerabilities, Aged Vulnerabilities (unfixed > 90 days), and three operational metrics — MOVA (Mean Open Vulnerability Age), MTTR (Mean Time to Remediate), and SLA Breach Rate.
Below the KPIs, the Risk Score Trend chart plots weekly org-wide risk over time. This is the chart that goes into board presentations — it shows whether your program is improving or degrading, not as a feeling but as a measurable trend line backed by daily snapshots stored in the database.
The dashboard also breaks down risk by asset type (virtual vs. server vs. network) and shows vulnerability distribution by severity — in the test environment, that’s 1,887 Critical, 5,242 High, 908 Medium, and 55 Low across 8,092 total open findings.
Threat Exposure Engine — The Differentiator
This is where VulnTrackPro separates from traditional scanners and most commercial VM tools. The Threat Exposure Engine is a parallel analysis layer that enriches every CVE in your environment with real-world threat context from six public intelligence sources:
| Source | What It Provides | Entries |
|---|---|---|
| CISA KEV | Known Exploited Vulnerabilities — confirmed active exploitation | 1,653 |
| EPSS | Exploit Prediction Scoring — probability of exploitation in next 30 days | 352,157 |
| MITRE ATT&CK | Threat actor profiles, techniques, and procedures | 1,927 objects |
| CVE→CWE Mapping | Weakness classification for technique inference | 300,766 |
| CPE Dictionary | Product/vendor identification for asset matching | 2.4M |
| Exploit DBs | Metasploit, Nuclei, ExploitDB, GitHub PoCs, CircL | 79,333 |
All data is downloaded from public sources and stored locally in PostgreSQL — there are no external API calls at query time. The enrichment engine runs in batches of 500 CVEs, processing the entire org’s exposure in seconds.
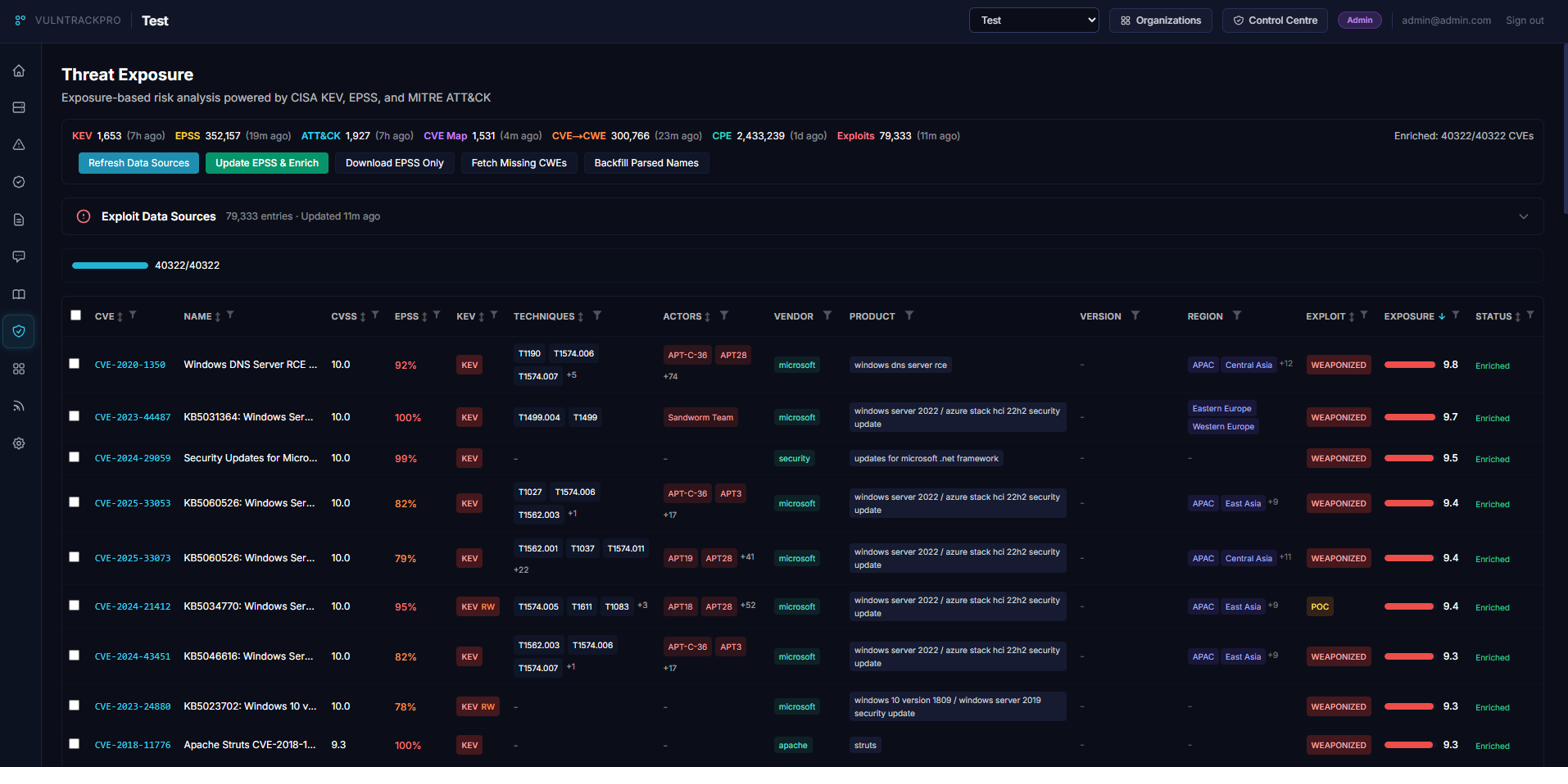 The Threat Exposure table — 40,322 enriched CVEs showing CVSS, EPSS probability, KEV status, ATT&CK techniques, associated threat actors, target regions, exploit maturity, and computed Exposure Score.
Exposure Score — How It Works
Each CVE gets a computed Exposure Score (0–10) that combines multiple threat signals into a single prioritization metric:
1
2
3
4
5
6
7
8
9
Exposure Score = min(10,
    CVSS × 0.30              // Technical severity baseline
  + EPSS × 3.0               // Exploitation probability (high weight)
  + KEV ? 2.0 : 0            // +2 if actively exploited per CISA
  + Ransomware ? 0.5 : 0     // +0.5 if tied to ransomware campaigns
  + Exploit Maturity          // WEAPONIZED: +1.5, FUNCTIONAL: +1.0, POC: +0.5
  + Regional Alignment        // Up to +1.0 if actors target your region
  + min(0.5, techniques×0.1) // ATT&CK technique coverage
)
This is not just a formula on paper — it’s implemented in the enrichment engine and recalculated on every data refresh. A CVE-2020-1350 (Windows DNS Server RCE) with a 92% EPSS, KEV listing, and weaponized exploit scores 9.8 exposure. A CVE-2023-44487 with 100% EPSS and Sandworm Team association scores 9.7. These float to the top regardless of the noise around them.
Exploit Maturity Classification
The platform classifies exploit availability into four tiers by querying five public exploit databases:
- WEAPONIZED — Metasploit module or mature offensive tooling exists
- FUNCTIONAL — Working exploit code available (ExploitDB, GitHub)
- POC — Proof-of-concept published but may not be reliable
- NONE — No public exploit found
This matters because a CVE with a Metasploit module is orders of magnitude more dangerous than one with only a theoretical advisory.
Regional Threat Alignment
VulnTrackPro maps ATT&CK intrusion sets (APT groups) to geographic regions using a 200+ entry country-to-region dictionary. When your organization configures its target regions (e.g., Middle East, APAC) in the Control Centre, the engine boosts the Exposure Score for CVEs used by threat actors that operate in your geography.
If APT28 targets Eastern Europe and your org operates there, every CVE in APT28’s toolkit gets a regional alignment boost. This is the difference between generic vulnerability management and threat-informed vulnerability management.
MITRE ATT&CK Heatmap
Every CVE is mapped to MITRE ATT&CK techniques using a hybrid approach:
- CTID curated mappings — High-confidence, human-reviewed CVE-to-technique mappings from the Center for Threat-Informed Defense
- CWE→CAPEC→ATT&CK inference — For CVEs without curated mappings, the engine chains CWE weakness types through CAPEC attack patterns to ATT&CK techniques, providing full coverage
The result is an enterprise-wide heatmap showing exactly where your vulnerability exposure concentrates across the kill chain.
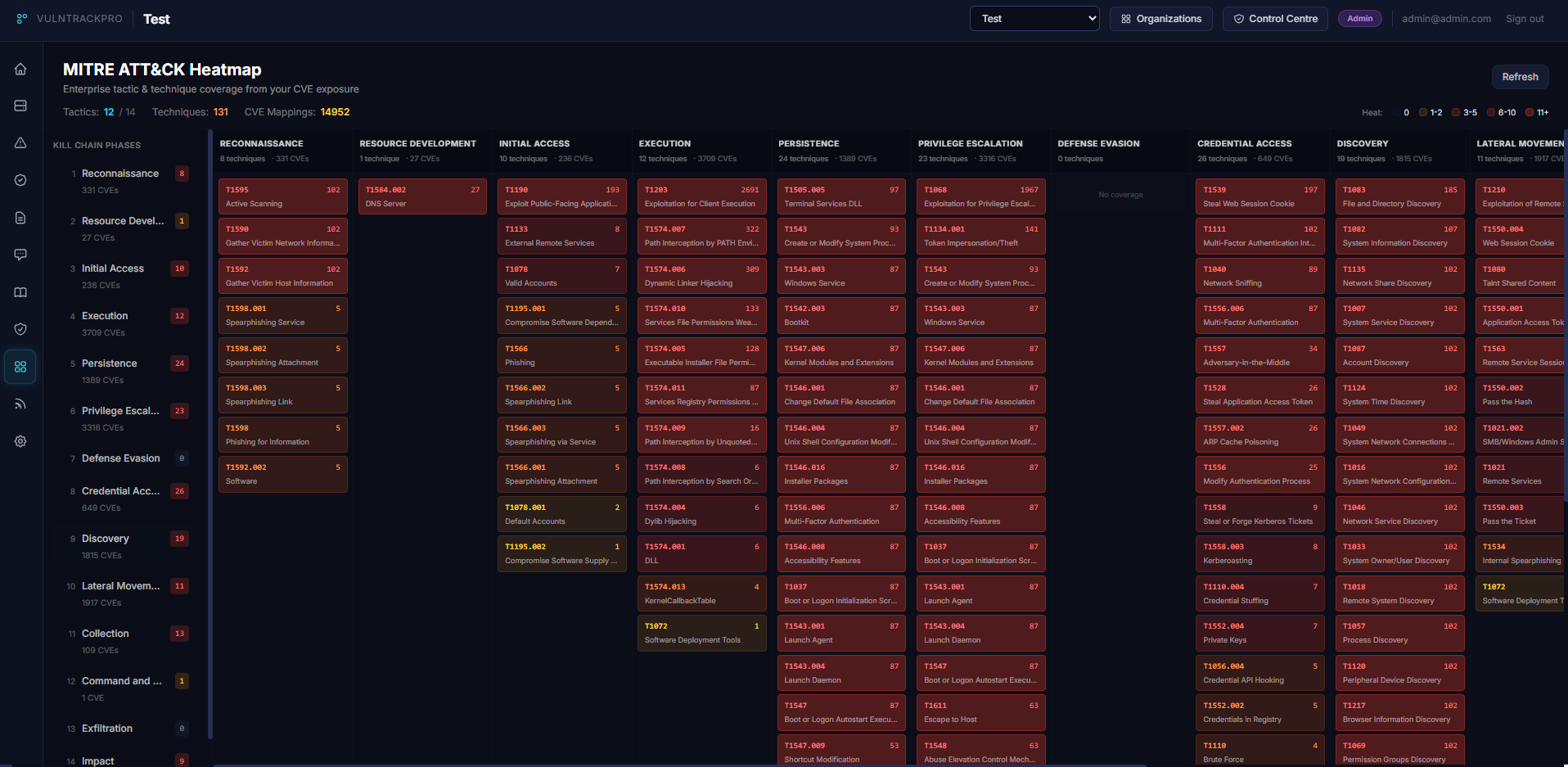 The ATT&CK heatmap — 12 tactics, 131 techniques, and 14,952 CVE mappings. Execution (3,709 CVEs) and Privilege Escalation (3,316 CVEs) show the heaviest concentration.
This heatmap answers questions like: “Are we more exposed to Initial Access or Lateral Movement?” and “Which techniques have the most CVE coverage in our environment?” — questions that pure CVSS sorting can never answer.
Risk Scoring Engine
VulnTrackPro’s risk scoring goes beyond simple CVSS aggregation. Every asset gets a Risk Score (0–100) computed from a multi-factor formula:
1
2
3
4
5
6
Age Penalty         = 0 / 0.5 / 1.0 / 1.5 (based on 30/60/90+ days unfixed)
Exposure Multiplier = 1 + (Exposure Score / 10)
Adjusted CVSS       = min(10, (CVSS + Age Penalty) × Exposure Multiplier)
Weighted Score      = Σ(Adjusted CVSS × Severity Weight) / Vuln Count
Net Exposure Factor = 1.25 if internet-facing, 1.0 otherwise
Asset Risk Score    = min(100, (Weighted Score × Criticality) / 2 × Net Exposure)
Key design decisions in this formula:
- Age penalty escalates — A vulnerability open 90+ days gets a +1.5 CVSS boost, reflecting increasing risk over time
- Exposure multiplier amplifies — The threat intel enrichment score directly multiplies adjusted CVSS, so weaponized + KEV + high-EPSS vulnerabilities can push a moderate CVSS to the cap of 10
- Internet-facing assets get a 25% boost — Because the same vulnerability on an internet-facing server presents materially more risk than on an internal one
- Unscanned assets aren’t zero-risk — Assets never scanned receive a baseline risk score proportional to their criticality, because unknown risk is not zero risk
- Failed credential scans get a penalty — If a scan ran without valid credentials, it likely missed findings, so the risk score adjusts upward
The Org Risk Score is a criticality-weighted average across all assets — higher-criticality assets contribute more to the org score, reflecting their business importance.
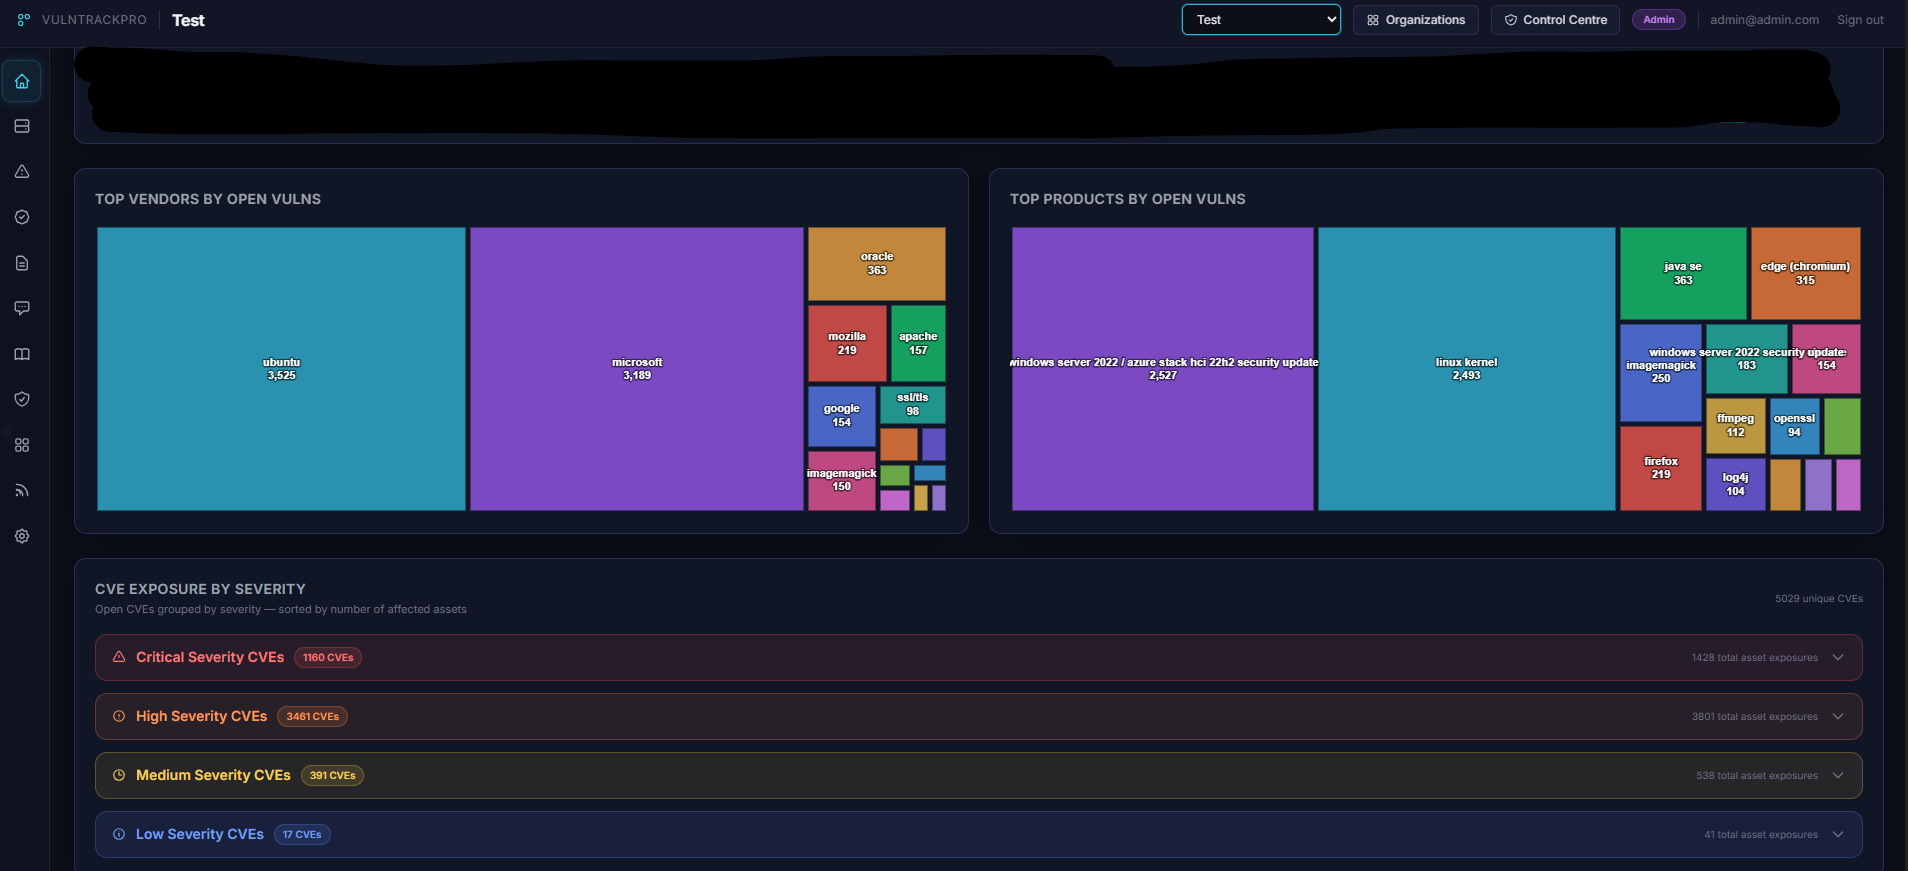 Top vendors by open vulnerabilities (Ubuntu: 3,525, Microsoft: 3,189, Oracle: 363), top products, and CVE exposure by severity — 1,160 Critical CVEs across 1,428 total asset exposures.
KPI Metrics & SLA Compliance
The KPI Metrics page tracks five operational health indicators:
- MOVA (Mean Open Vulnerability Age) — Average age of all open vulnerabilities. Test org: 81 days
- MTTR (Mean Time to Remediate) — Average time from discovery to resolution for closed vulns. Test org: 130 days
- SLA Breach Rate — Percentage of open vulns past their SLA deadline. Test org: 90%
- Recurrence Rate — Vulns that returned after being fixed. Test org: 6.7%
- MTTD (Mean Time to Detect) — Average time from CVE publication to first scan detection. Test org: 179.5 days
SLA policies are admin-configurable per severity — defaults are Critical: 7 days, High: 14 days, Medium: 30 days, Low: 90 days. The platform automatically flags breaches and tracks compliance by severity level.
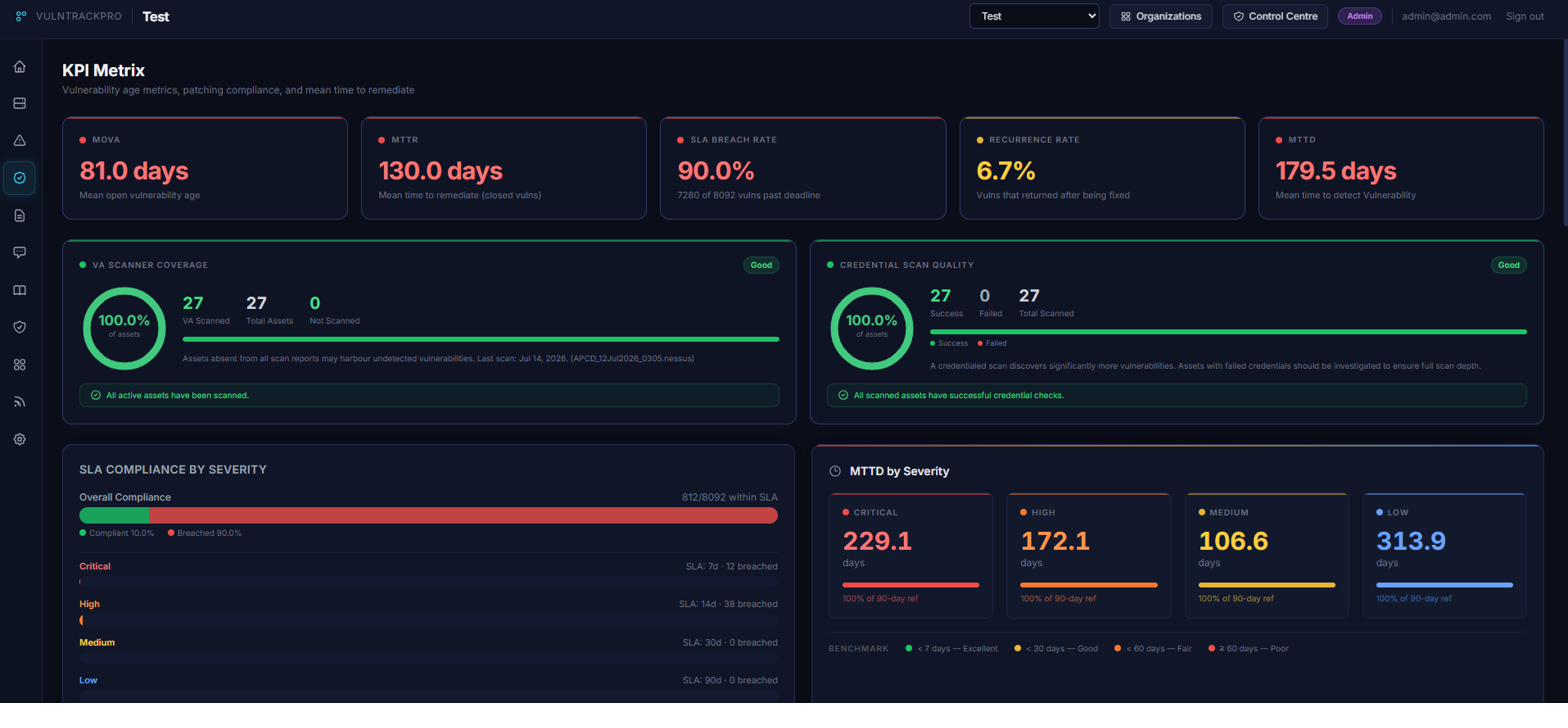 KPI dashboard with MOVA, MTTR, SLA breach rate, recurrence rate, and MTTD. Scanner coverage and credential scan quality both at 100% with “Good” status.
Two operational health gauges round out the page: VA Scanner Coverage (what percentage of assets have been scanned) and Credential Scan Quality (how many scans ran with valid credentials). Both metrics matter — an asset absent from scan reports may harbor undetected vulnerabilities, and an uncredentialed scan discovers significantly fewer findings.
Vulnerability Lifecycle Tracking
VulnTrackPro tracks the full lifecycle of every vulnerability:
- Discovery — When a vulnerability first appears in a scan, timestamped and severity-classified
- Aging — Open vulnerabilities accumulate age, with escalating risk penalties at 30, 60, and 90 days
- Resolution — When marked as fixed, the
resolved_dateis recorded and MTTR is calculated - Recurrence — If a previously-fixed vulnerability reappears in a new scan, the
recurrence_countincrements and the SLA clock resets - Risk Acceptance — Vulnerabilities can be formally accepted with documented justification, removing them from active risk calculations
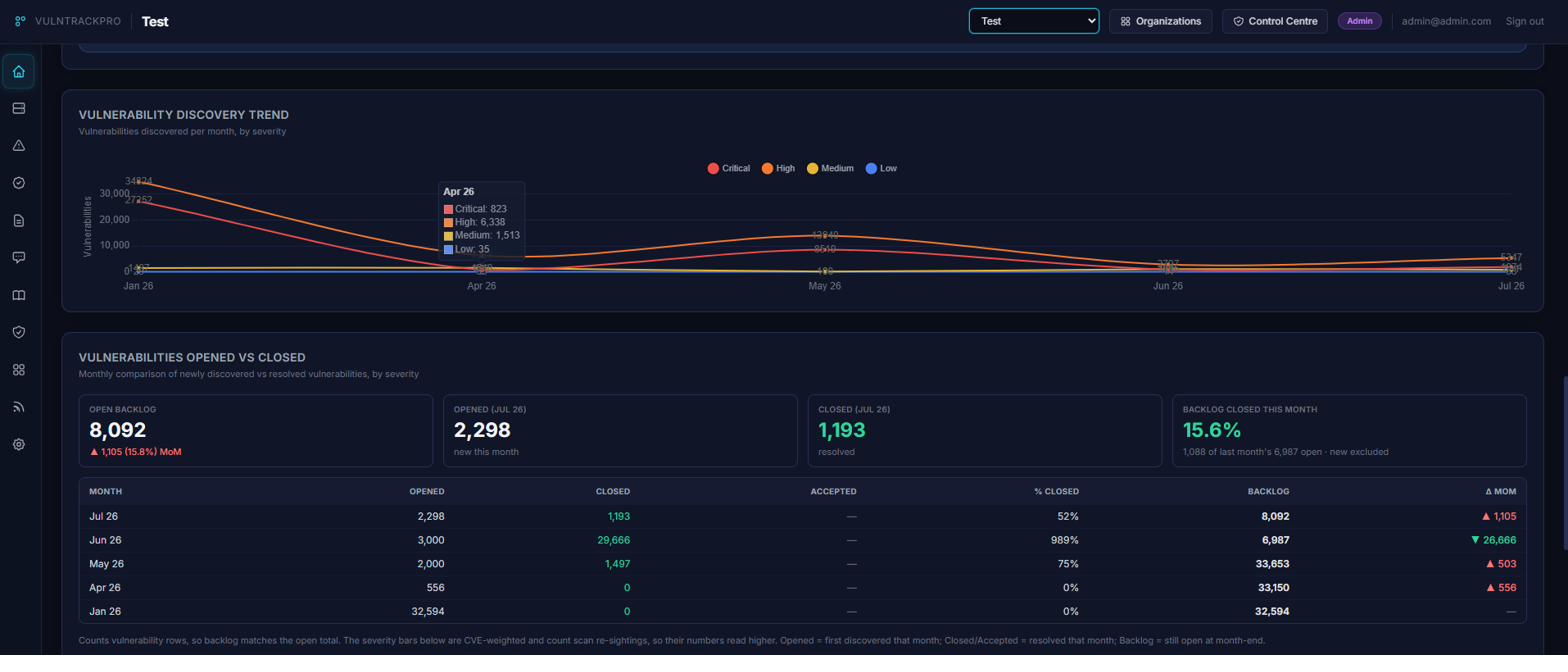 Vulnerability discovery trend (Jan–Jul 2026) and the opened vs. closed table — July: 2,298 opened, 1,193 closed, 52% closure rate, backlog at 8,092 (up 15.8% MoM).
Asset Management & Exposure Visibility
Assets are tracked with full context: hostname, IP, OS version, environment (Production/Staging/Dev), criticality (1–10), exposure posture (Internet-facing or Internal), and business function. The top-10 riskiest assets are always visible on the dashboard.
The Open Vulnerability Age panel segments the backlog into four urgency buckets:
- > 90 days — 2,611 vulns (Critical — long overdue)
- 61–90 days — 0 vulns (approaching breach)
- 31–60 days — 2,384 vulns (Medium — monitor closely)
- ≤ 30 days — 3,097 vulns (recently discovered)
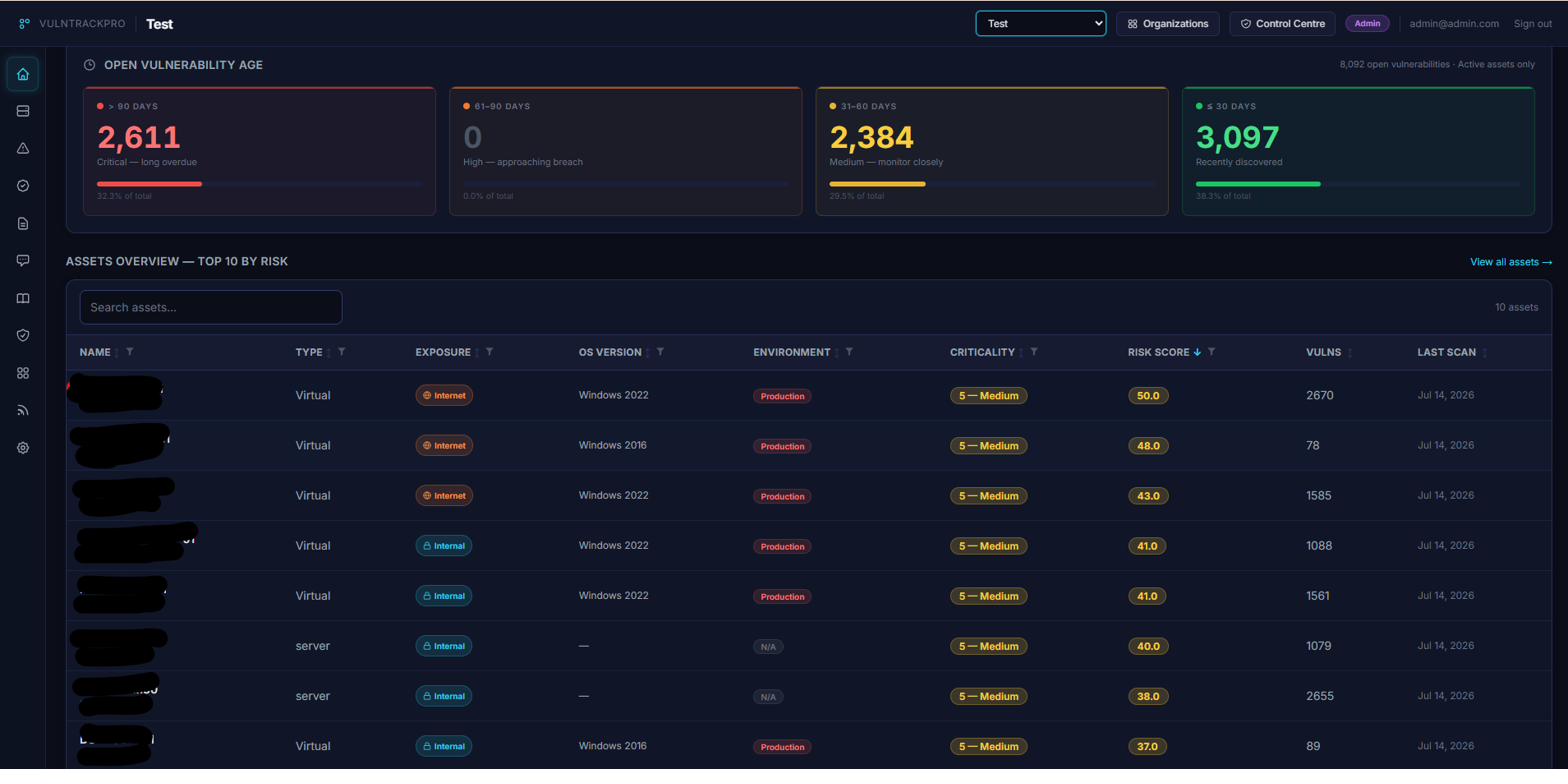 Open vulnerability age buckets and top-10 assets by risk score — production Windows 2022 and Windows 2016 servers with internet exposure leading the list.
Remediation Prioritization Reports
VulnTrackPro generates prioritized remediation reports (PDF and Excel) that rank CVEs not by CVSS alone, but by a composite priority score incorporating affected asset count, criticality, EPSS probability, KEV status, exploit maturity, internet-facing exposure, and — critically — the estimated org risk score reduction if the CVE group is fully remediated.
Each remediation group includes a suggested action and the estimated risk delta, so teams can answer: “If we patch this one CVE across all affected assets, how much does our org risk improve?”
AI-Powered Security Assistant
VulnTrackPro includes an AI chat interface powered by a local Ollama LLM (e.g., Llama 3.2) integrated via LangChain. The assistant uses a tool-calling architecture — the LLM generates structured tool calls, the server validates them against RBAC policies, executes parameterized Supabase queries, and returns results for natural language summarization.
Available capabilities:
- Query assets and vulnerabilities in natural language (“Show me all critical vulns on internet-facing servers”)
- Search by CVE ID, hostname, EPSS score, age, or risk level
- Update asset criticality, owner, or environment (admin only)
- Change vulnerability status or add comments (admin only)
- RAG-powered answers from uploaded security policies and runbooks via hybrid vector + full-text search
All update operations are audit-logged. Non-admin users only see read-only query tools — update tools are omitted from the system prompt entirely. Everything runs on-premise with no data leaving the environment.
Control Centre & Multi-Tenancy
The platform supports multi-organization deployment with strict tenant isolation enforced at the database level via PostgreSQL Row-Level Security (RLS). Each organization has its own assets, vulnerabilities, scans, SLA policies, and threat intel configuration.
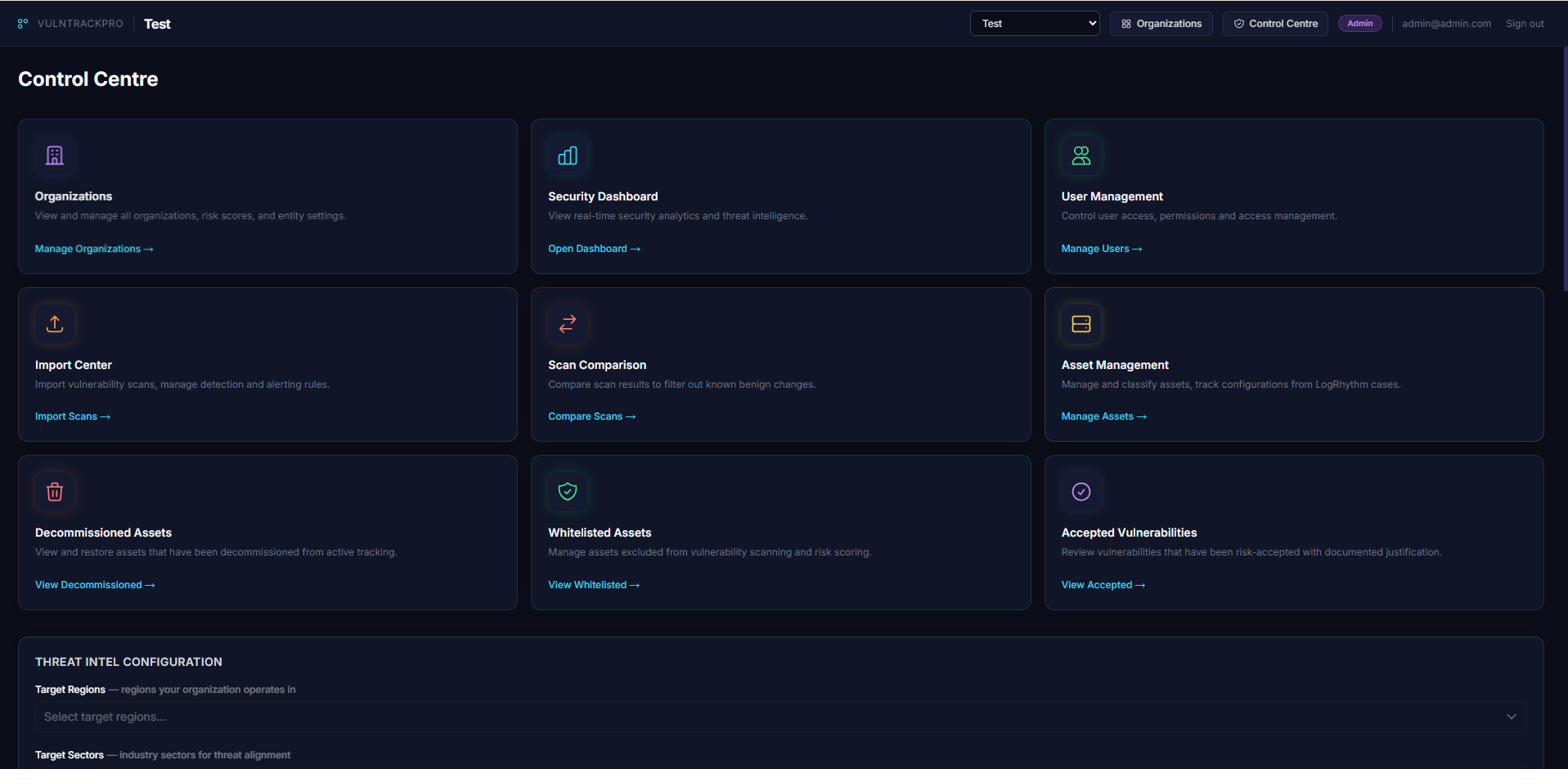 The Control Centre — organizations, security dashboard, user management, scan imports, scan comparison, asset management, decommissioned assets, whitelisted assets, accepted vulnerabilities, and threat intel configuration.
The admin hub provides:
- Target Regions & Sectors — Geographic and industry configuration for threat actor alignment
- Import Exclusion Rules — Per-org filters to suppress noise at scan import time
- User Role Management — Admin, Manager, Viewer with permissions enforced at every layer
- Asset Lifecycle — Decommission, whitelist, or accept-risk with full audit trail
Under the Hood
| Layer | Technology |
|---|---|
| Framework | Next.js 16 (App Router + API Routes) |
| Frontend | React 19, Tailwind CSS (dark theme) |
| Database | Supabase (PostgreSQL + RLS + Auth) |
| Charts | Chart.js + Treemap + Datalabels |
| State | Zustand (org/role) + React Context (auth) |
| AI | LangChain + Ollama (tool-calling + RAG) |
| Reports | jsPDF + jspdf-autotable, SheetJS (XLSX) |
| File Processing | Mammoth (DOCX), pdf-parse, Tesseract.js (OCR) |
| Validation | Zod (runtime schema validation) |
| Parsing | csv-parse, fast-xml-parser (.nessus XML) |
How It Helps — The VM Program Maturity Shift
| Without VulnTrackPro | With VulnTrackPro |
|---|---|
| Patch by CVSS severity alone | Prioritize by exploitability, threat actors, and exploit availability |
| Scan results in spreadsheets | Centralized asset-to-vulnerability mapping with full lifecycle tracking |
| No SLA tracking | Configurable SLA policies with automated breach detection |
| “How’s our risk?” → no clear answer | Quantified org risk score with weekly trend and daily snapshots |
| MITRE ATT&CK is a poster on the wall | ATT&CK heatmap mapped to your actual CVE exposure |
| Remediation order is gut feel | Prioritized reports with estimated risk reduction per fix |
| Ask the analyst | Ask the AI — natural language queries against live vulnerability data |
What’s Next
The roadmap includes attack path analysis (chaining techniques across assets to model multi-step attack scenarios), automated Nessus Server API integration for scheduled scan imports without manual file uploads, a CISO-grade executive dashboard with board-ready reporting, and expanded scanner support beyond Nessus (Qualys, Rapid7, OpenVAS).
The AI module is being extended with deeper RAG capabilities and live CVE intelligence scraping — enabling the assistant to pull advisories, vendor patches, and remediation guidance directly into conversations.